Weekly content

1 Introduction and foundations
A brief introduction to the course, preview of things to come, and some foundational background material.

2 Linear regression
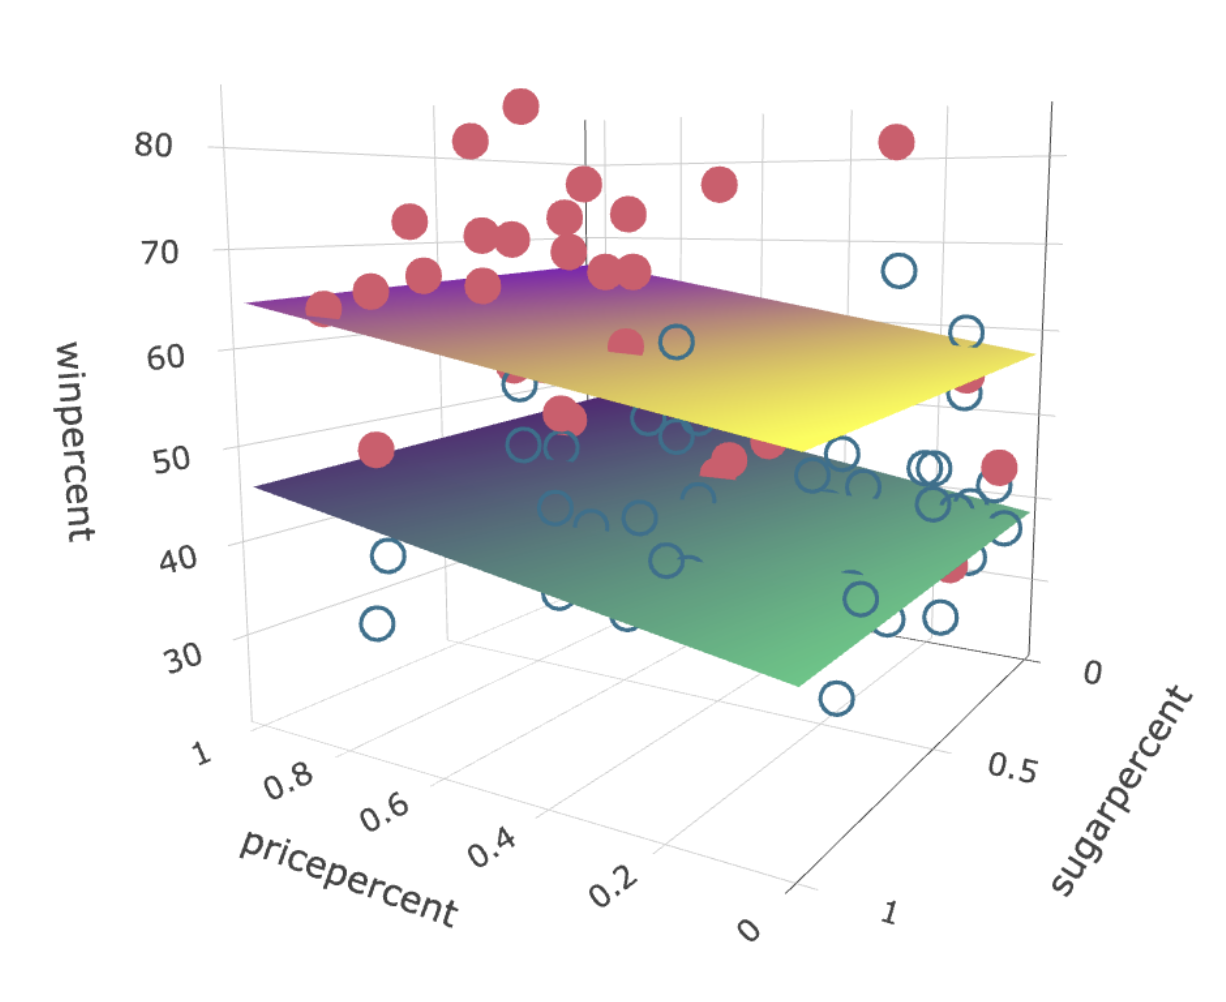
Reviewing linear regression and framing it as a prototypical example and source of intuition for other machine learning methods.
3 Interpreting regression and causality
Multiple linear regression does not, by default, tell us anything about causality. But with the right data and careful interpretation we might be able to learn some causal relationships.
4 Classification
Categorical or qualitative outcome variables are ubiquitous. We review some supervised learning methods for classification, and see how these may be applied to observational causal inference.
5 Optimization and model complexity
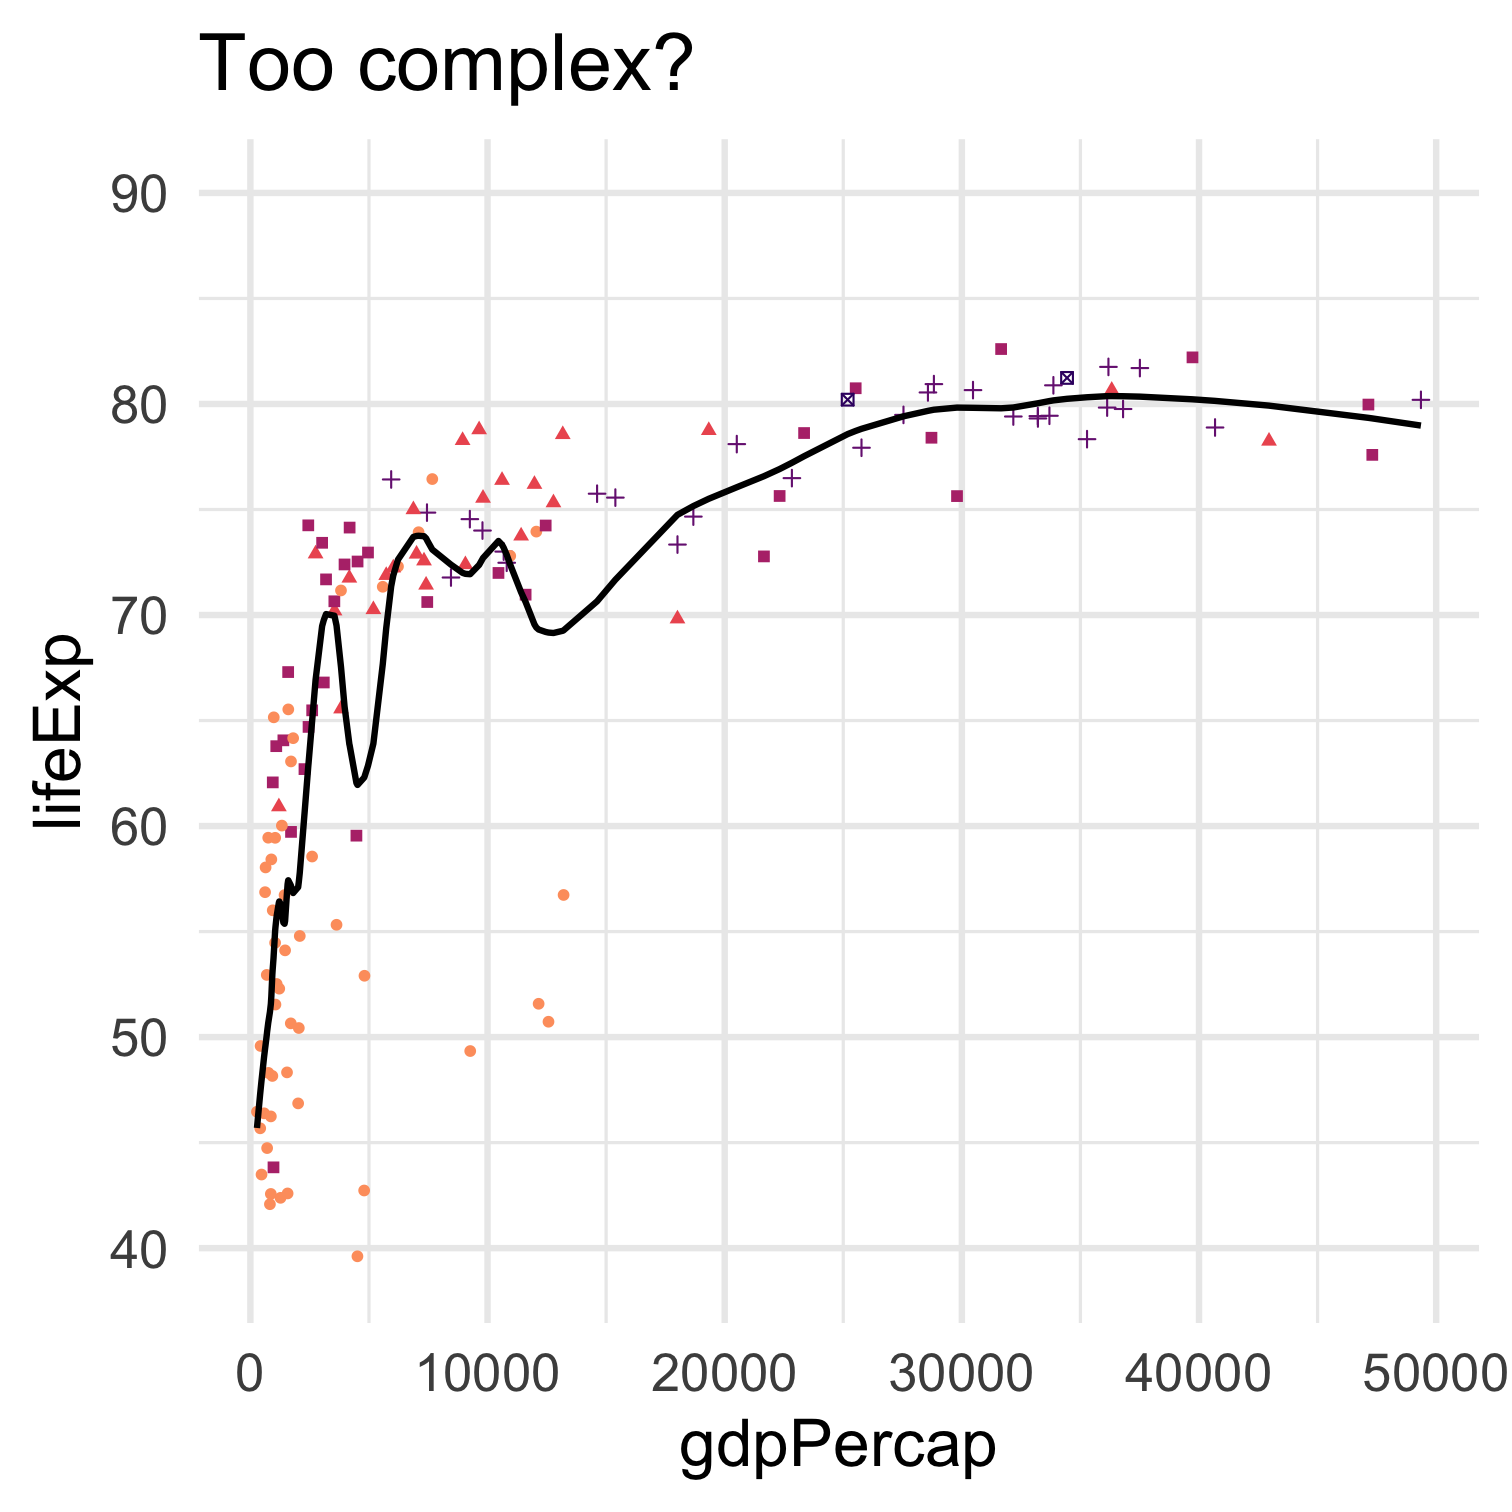
Machine learning is broadly about estimating functions using optimization algorithms. We can think of these as searching through a space of functions to find one that minimizes a measure of inaccuracy or loss.
6 Regularization and validation
When optimizing an ML model there are a variety of strategies to improve generalization from the training data. We can add a complexity penalty to the loss function, and we can evaluate the loss function on validation data.
7 High-dimensional regression
Regression with many predictor variables can suffer from a statistical version of the curse of dimensionality. Penalized regression methods like ridge and lasso are useful in such high-dimensional settings.
8 Additive non-linearity
We continue our exploration of non-linear supervised machine learning approaches including tree based methods, GAMs, and neural networks and graphs structured learning.
8 More nonlinear methods
We continue our exploration of non-linear supervised machine learning approaches including tree based methods, GAMs, and neural networks and graphs structured learning.
9 Less interpretable methods
Neural networks and ensemble methods like bagging, random forests, and boosting can greatly increase predictive accuracy at the cost of ease of interpretation.
10 From prediction to action
Supervised machine learning methods excel at predicting an outcome. But being able to predict an outcome does not mean we know how to change it, or that we should.
11 To the future
Some resources for learning more and suggestions on what to study next.